January 15th, 2010
The first of the mighty banks have started rolling out their results. JP Morgan disclosed a big bump in the revenues of its investment banking division. The financial statements on the whole were characterized by a higher amount of Credit loss provisions a possible indicator of future defaults and a weaker credit environment.
INVESTMENT BANKING
This division showed a huge bump in its Q4 Net Income and Revenues compared with the same period last year. Provision for credit losses was actually a benefit for Q4 2009 as compared to Q4 2008 driven by lower loan balances, loan sales and repayments.
COMMERCIAL BANKING:
Effect of the higher credit loss provisions can be seen specially in the Commercial banking division. These provisions increased by almost 160% to $ 494 million for Q4 2009 up by $ 304 million for Q4 2008. Commercial Banking net income on the other hand declined to $ 224 million, a fall of 53% compared to full year 2008.
ASSET MANAGEMENT:
Both net income and net revenues are up as compared to 2008. Business Metrics for this division indicate an increase int eh number of Client advisors, Retirement planning services participants as well as ….surprise ….Bear Stearn brokers. How the number of Bear Stearn brokers can increase over 2008 is a little hard to understand.
For the company as a whole, for the full year 2009, $100 billion has been kept aside for Compensation expenses as compared to $ 67 billion for 2008. Compensation as a percentage of net revenue actually declined to 27% as compared to 34% for 2008. For Investment Banking division alone, there has been a drop in the percentage of compensation to revenue to 33% from 62% for 2008.
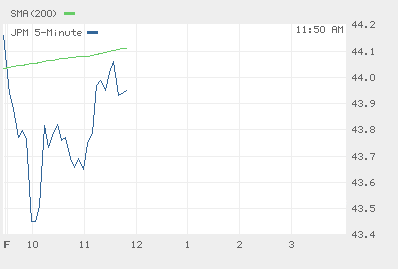
JP Morgan’s spectacular earnings don’t seem to have buoyed the market. As you can see from the image below, these results seem to have dampened JP Morgan’s performance in the market. (Courtesy: The Wall Street Journal)

please wait...
Rating: 0.0/5 (0 votes cast)
Tags: Earnings, JP Morgan Chase
Posted in Earnings, JP Morgan Chase, company | No Comments »
January 14th, 2010
The focus this week has been on the big banks.
Wednesday was ‘bank bashing’ day over at the Financial Crisis Inquiry Commission. Unusually pertinent and pointed questions and as usual ambiguous, ‘beating around the bush’ answers characterized the session.
On another note, a WSJ article indicated a possible ‘one upmanship’ between Goldman and Morgan Stanley. Both banks tried to outdo each other and announce their earnings before the other. Apparently, there is some belief that the bank with the earliest earnings announcement ‘catches the worm’, interms of a stock price rally. Talk about being hyper competitive….
Anyway, so here at InvesGuard we have also been doing our little bit of bank scrutiny in terms of their compensation data. Over the past two posts, we looked at JP Morgan as well as Bank of America and today we will be reviewing the profile of Goldman Sachs.
Instead of writing reams and reams on Goldman’s compensation practices, I thought it would be better if I just present this data and leave the analysis to you. The data sort of speaks for itself.
Compensation for 9 months ended 2009: $ 16712 million
Compensation for 9 months ended 2008: $ 11424 million
Increase in 2009 over 2008? : Of course (its Goldman we’re talking about, remember?)
Percentage Increase in Compensation : 46%
Number of employees for 9 months ended 2009: 31700
Average Per employee compensation (2009): $ 527,000
Average Per employee compensation (2008): $ 303,800
Ration of Compensation and benefits to Net Revenues (9months 2009): 47%
Revenue Change (9 months Year over Year comparison)
Investment Banking Revenues: Significantly lower
Trading and Principal Investments: Significantly higher by 108%
Asset Management and Securities Services: Lower
So what do analysts say about Goldman?
Out of 26 analysts surveyed, only 9 (less than half) had a strong buy recommendation, 7 had a ‘hold’ and 10 analysts recommended a ‘buy’. (Source: First Call / Thomson Financial)
InvesGuard Score:
Over extended directors, board independence issues coupled with poor Social and Environmental disclosures give Goldman an average rating. Look it up here.
Come January 21, (Goldman’s Quarter 4 earnings release), it should be interesting to see whether all the donations, charitable giving and some press coverage is enough to counteract the negative public perception of its earnings.
please wait...
Rating: 5.0/5 (1 vote cast)
Tags: bankers pay, Goldman Sachs
Posted in Earnings, Goldman Sachs, Uncategorized, company | No Comments »


